| Type of Day | Mean | SD | Count |
|---|---|---|---|
| Weekday | 62.1 | 25.3 | 200 |
| Weekend | 83.0 | 29.8 | 200 |
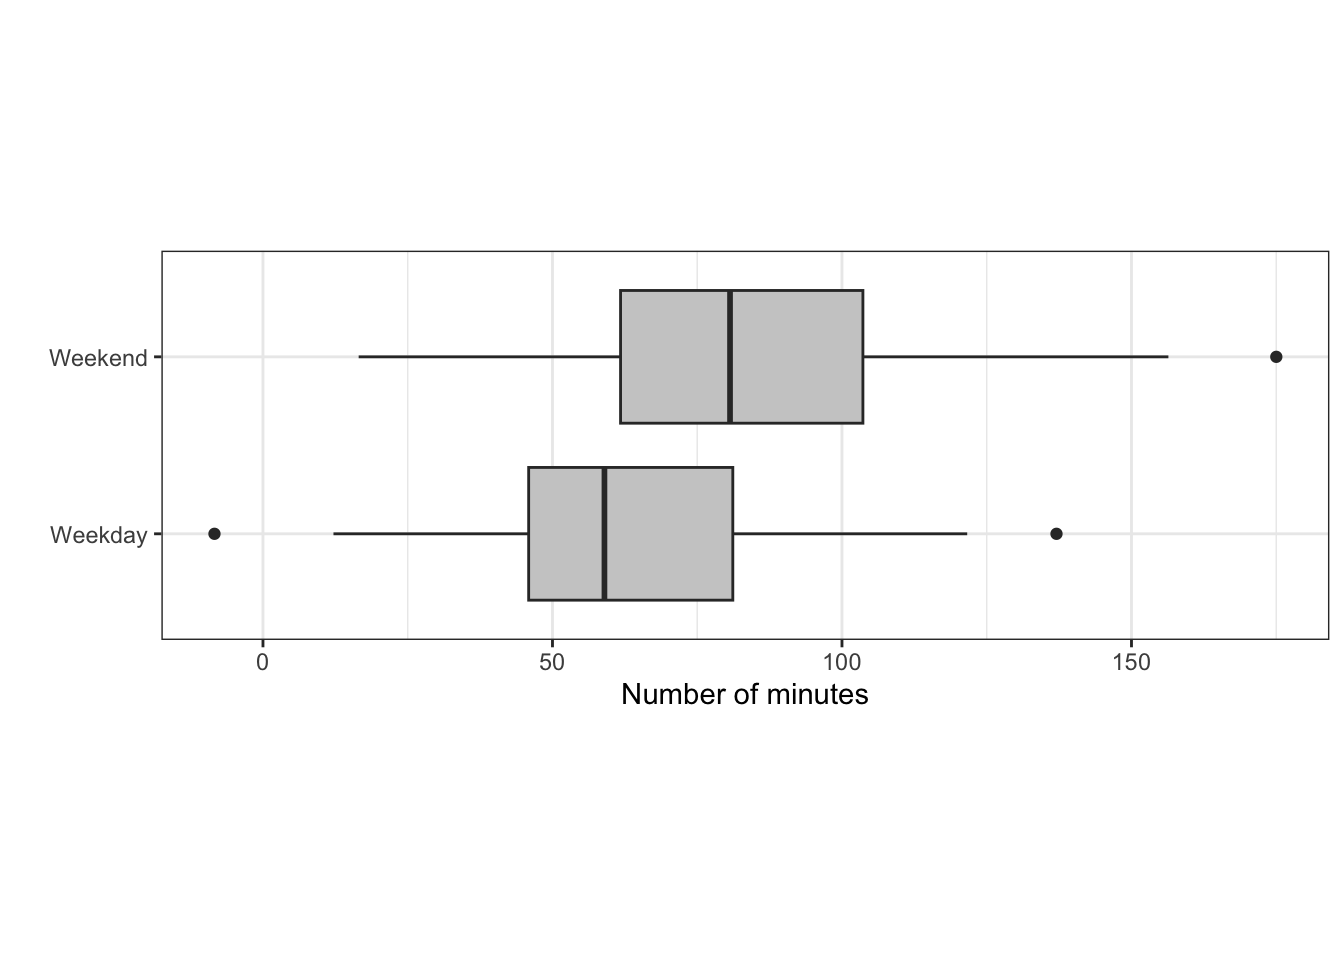
A data analyst at YouTube is interested in determining whether users watch more videos on weekends than on weekdays. To investigate this question, the analyst randomly selects 400 YouTube users from the platform’s user population who watch YouTube on a daily basis. Using each user’s viewing history over the previous month, the analyst calculates the average number of minutes each user spends watching YouTube per day on weekdays and weekends. The analyst then randomly assigns each participant so that the number of minutes watched is averaged for weekdays or weekends (i.e., 200 participants having responses for weekdays and the other 200 participants having responses for weekends).
A plot of the data and descriptive statistics are provided below.
| Type of Day | Mean | SD | Count |
|---|---|---|---|
| Weekday | 62.1 | 25.3 | 200 |
| Weekend | 83.0 | 29.8 | 200 |
Answer each of the following questions.