Project 2
Complete each problem using the scenario described below. You must type up your solutions and submit them as a pdf file to Canvas. While your solutions must be typed, you may show your work by attaching screenshots of legible handwriting. You are allowed to work with your classmates, but you are responsible for completing and submitting your own work (i.e., do not copy your classmate’s work verbatim).
A study of the Minnesota River is measuring the amount of Nitrogen in mg/L. Historical records suggest that the average quantity of Nitrogen is 4.19 mg/L. To conduct their study, researchers take 40 water samples from randomly determined locations from the river and measure the quantity of Nitrogen. They are interested in if Nitrogen has increased from the historical average.
- What is the population of interest?
- What is the observational unit?
- What is the sample?
- Why is it important that the sample locations were randomized? What could happen if they took all 40 samples from the same location?
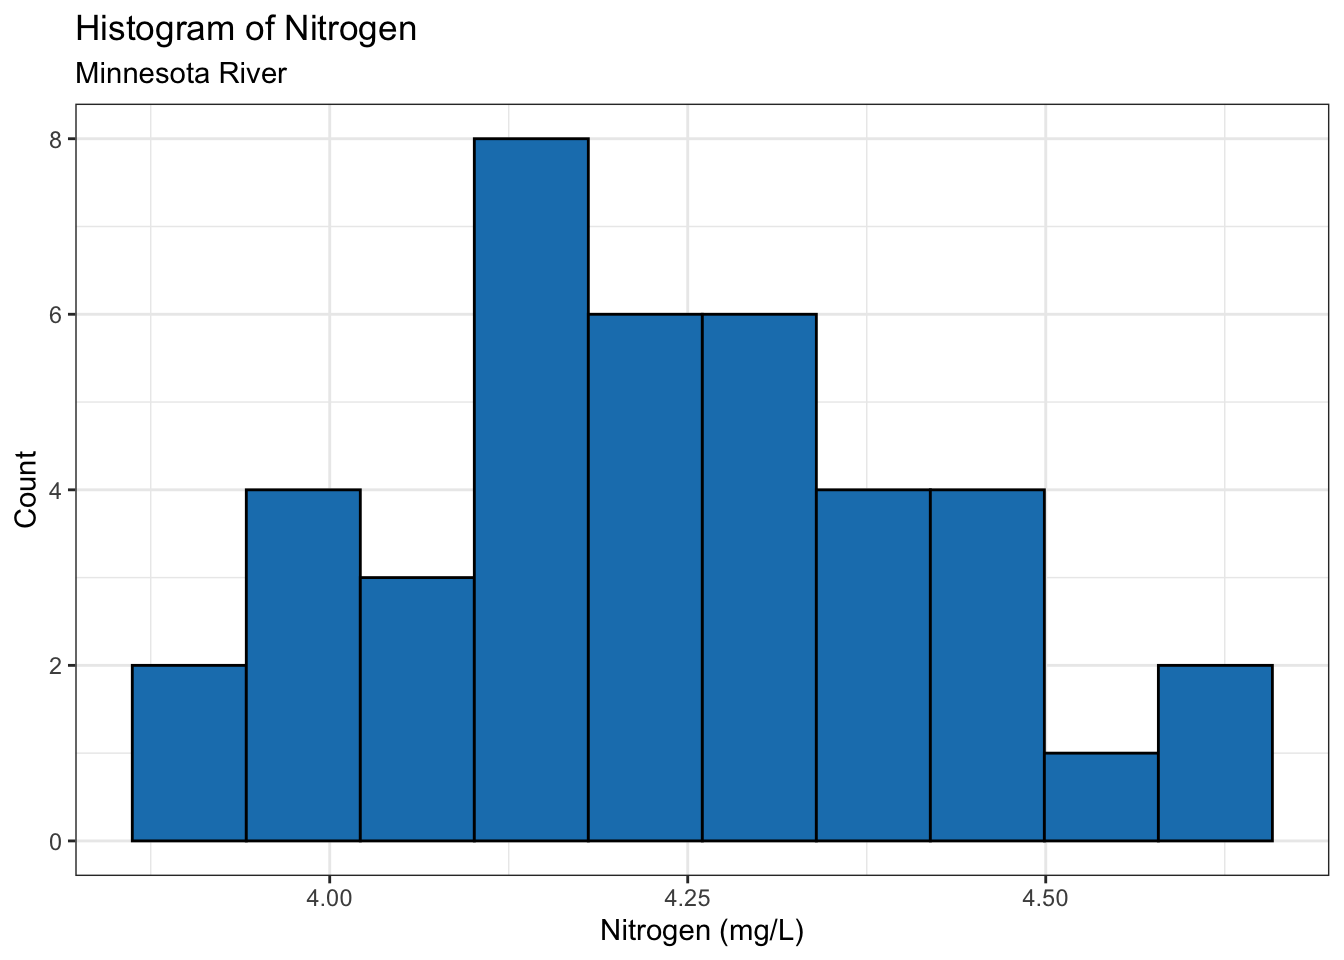
A histogram of the data is plotted below. The mean of the samples was computed to be 4.23 mg/L and the standard deviation was computed to be 0.19.
- Are the validity conditions met for using the theory-based approach? Explain why or why not.
- Define the null and alternative hypotheses in words.
- Define the null and alternative hypotheses in symbols.
- Compute the standardized statistic. Does this reject or fail to reject the null hypothesis?
- Compute and interpret the 95% confidence interval. Does this interval reject or fail to reject the null hypothesis?
- Write a conclusion that satisfies the research question.
The results of the lab analysis also showed that 11 of the 40 samples had sulfate quantities that exceeded the safe limit, although the specific test did not provide the exact quantities of sulfate. Knowing that another set of water samples would have different results, the researchers want to estimate the proportion of samples that exceed the safe limit of sulfate.
- Define the parameter of interest in words and provide its appropriate symbol.
- Compute the 95% confidence interval and interpret its meaning.
- Would it be accurate to say that more than 10% of samples have sulfate quantities that exceed the safe limit? Explain why or why not?